
Loop One User Guide
User Guide
Introduction
Welcome to the future of air quality measurement. What you got in your hands is the world’s best indoor air quality measurement device. Make sure you read this user guide carefully, because wrong handling or faulty installation of the device can have a negative impact on the measurement results.
Loop One device works autonomously, is automatically calibrated and the only maintenance is a battery charge that needs to be done approximately every 6-18 months, depending on device configuration and radio conditions. A device can be configured remotely via Loopshore cloud service. Contact us for more information.
Device communicates to cloud service via secured and encrypted data channel utilizing 4G/5G networks.
Safety
| Topic | Information |
|---|---|
| Usage | For indoor use. Outdoors, the device must be protected from rain, see Outdoor Installation. |
| Recommended operating conditions: Min. 0°C - max. +40°C, min. 0%RH - max. 85%RH, non-condensing.* | |
| The device operates down to -20°C, but below 0°C some measurements do not work or are less accurate, see Table 1b. | |
| Battery | Device can be used as battery operated or as connected to a USB charger. Device can work up to 18 months with a single charge. |
| Full battery charging takes approximately 8 hours in normal indoor conditions. | |
| Charging only with a compatible USB-C charger. | |
| Battery does not charge below 0°C. Charging is up to 10x slower at 0–10°C. | |
| Capacity decreases in the cold: at -10°C the battery provides approximately 70% of its rated capacity. | |
| Casing | IP-class 20. >12.5mm objects. No liquid protection. Outdoors, the device must be protected from rain and snow. |
| In case of problems | Turn off the device. Contact manufacturer. |
| Manufacturer contact information | info@loopshore.com, loopshore.com |
| CE declaration of conformity | Loopshore Oy declares that Loop One respects directive 2014/53/EU on radio equipment. Complete declaration of conformity can be ordered by contacting info@loopshore.com. |
Package Contents
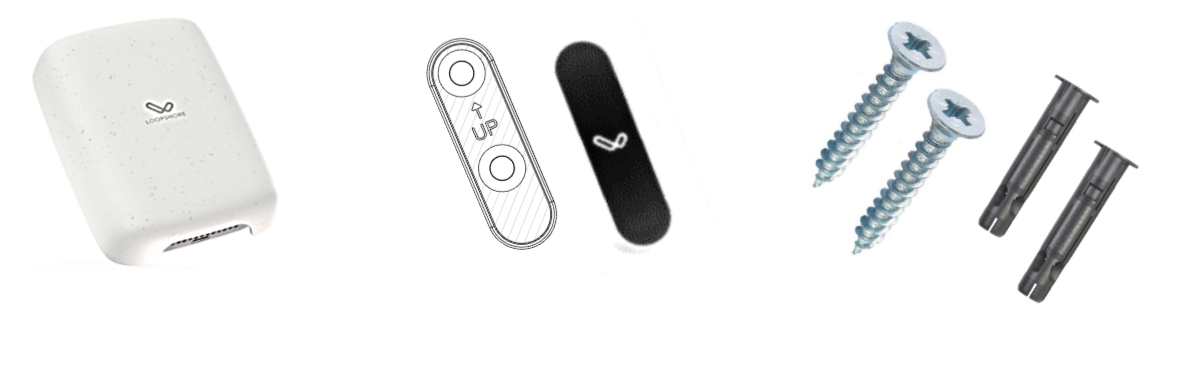
| Item | Description |
|---|---|
| Loop One | The device |
| Magnetic wall mount and cover sticker | For wall installation |
| Screws and plugs | For mounting |
Installation
Warnings
- Install indoors, or outdoors protected from rain. The device’s own enclosure is IP 20 and is not waterproof.
- Do not drop.
- Do not install the device upside down. The device can be mounted vertically on a wall or placed horizontally on a flat surface with the back facing down.
- If device has been outside of recommended operating conditions (0°C to +40°C and 0%RH - 85%RH), let it settle in normal indoor conditions for one hour before turning on the power.
Placement
Install the device to a central location, where it is exposed to average room conditions as good as possible.
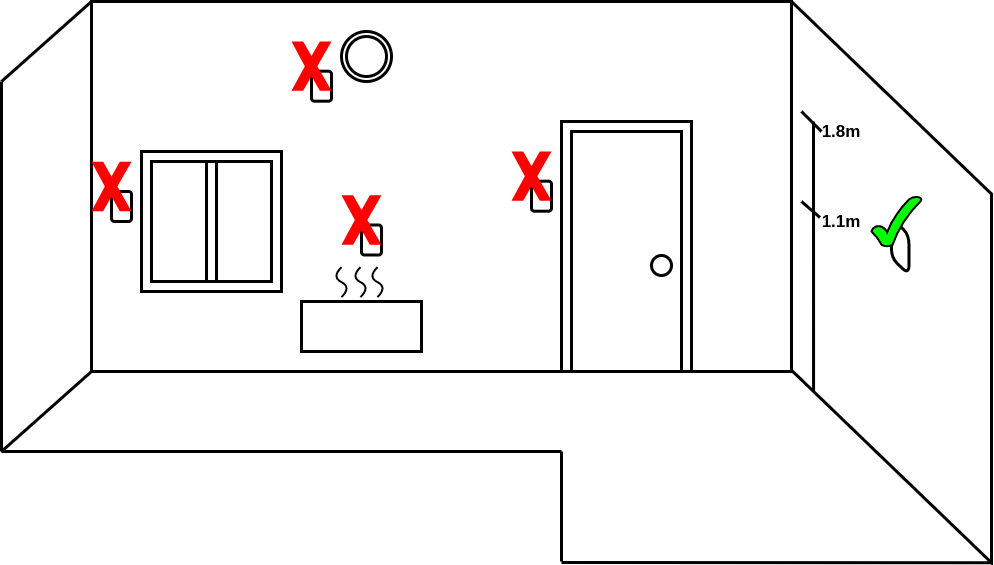
Avoid installing near:
- doors and windows
- air vents
- heat sources
- external walls
Installation height should be 1.1 to 1.8 meters.
Mounting
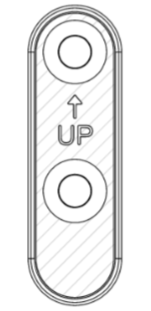
Attach the wall mount to the wall with the screws that are included in the package. Use plugs if necessary. Finalize installation with cover sticker.
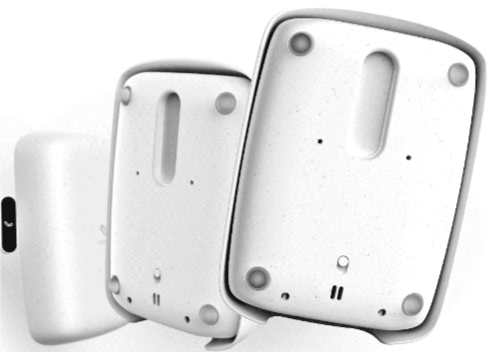
- Turn the device on from the switch located at the back side.
- You’ll hear a beep indicating that the device is operational and measuring.
- Place the device on the magnetic wall mount.
Tip: You can also attach the wall mount using picture hanging strips (e.g. 3M Command strips, 12–20 mm wide) instead of screws. This requires no drilling and leaves no marks on the wall if the mount is later removed.
Flat Surface Installation
Alternatively, the device can be placed on a flat surface e.g. on a bookshelf. This might have a slight impact on measured results, because air flow through the device is not optimal. It will however, still give you a very good overview of the room’s indoor conditions and might be a good option if you for some reason can’t drill holes to the walls.
Note that people are more likely to interact and play with a device that is laid on a surface and you might observe spikes e.g. in temperature and CO2 levels if a human is handling the device.
Outdoor Installation
Loop One can also be installed outdoors when the device is protected from rain. The device operates outdoors, but not all measurements work across the full temperature range. The limits come from the operating ranges stated by the sensor manufacturers, see Table 1b.
Protection: The device’s own enclosure is IP20 and is not waterproof. Outdoors, the device must be protected from rain and snow, including driving rain, as well as from splashing water and snow accumulating on the device. The protection must not prevent air exchange. The device measures the surrounding air, so air must be able to flow freely around the device. In a closed enclosure the device measures the air inside the enclosure rather than the outdoor air, and moisture can build up inside the enclosure.
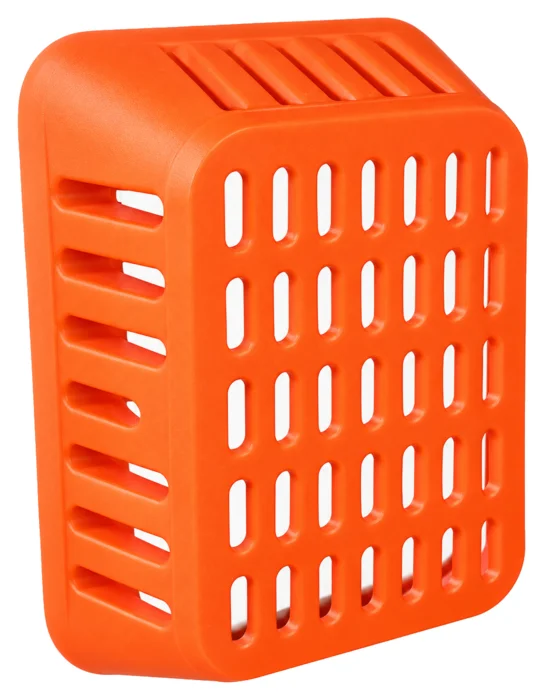
Protective cage is a 3D-printed, screw-fastened grille that protects the device from impacts and prevents it from being removed without tools. It is suitable for sites where the device is exposed to knocks, vandalism or theft.
When installing outdoors, note:
- Temperature: The device operates at -20°C to +40°C. All measurements work at 0°C to +40°C.
- CO2 does not work below freezing. The CO2 sensor’s operating range is 0°C to +50°C.
- tVOC and VOC index are limited in the cold. The tVOC sensor is most accurate at 0°C to +40°C, and the low absolute humidity of freezing air degrades the measurement (see tVOC). The VOC index sensor’s operating range is -10°C to +50°C.
- Particulate matter measurement works down to -10°C and is most accurate at +10°C to +40°C. In fog and very humid air, water droplets can show up as elevated particle readings.
- Temperature, humidity, air pressure, noise, ambient light and motion work across the device’s full temperature range.
- Condensation: When the temperature drops quickly or the air is close to saturation, moisture can condense inside the device. Condensed moisture can distort measurements and damage the device. The temperature and humidity sensor is the only sensor in the device that its manufacturer has rated to operate in condensing conditions.
- Sunlight: Direct sunlight heats the device and its protection, so the temperature and humidity readings do not reflect the outdoor air. Install the device in a shaded location.
- Battery: The battery does not charge below 0°C, not even when connected to a USB charger. Capacity decreases in the cold (approximately 70% of rated capacity at -10°C), so the charging interval becomes shorter.
- Bringing indoors: When you bring the device indoors from freezing conditions, keep it switched off and let it settle in indoor conditions for at least one hour before switching it on.
Outdoor installation and protecting the device are the user’s responsibility. Damage caused by liquid or moisture is not covered by the warranty.
About Device Operation
Device operates autonomously and normally does not need any adjustments. Following chapters describe device’s default behavior as well as some of the configuration possibilities.
Measurement General Information
Device’s default measurement interval is 10 minutes and this can be adjusted remotely to be anything between 10s to 24h. Note that additional data charges may apply if interval is less than 10 minutes.
There are specific power saving features described in the following chapters (SPL and PM). These features are controlled together by the Power Save setting (see below) and can be enabled or disabled remotely if needed.
Note that adjusting measurement interval and power saving features might have a dramatic effect on the device’s battery life and data usage. The effect can be positive or negative depending on the configuration.
Additionally, device sensors can be calibrated remotely, measurements can be enabled/disabled per quantity, and the device has a GPS that can be enabled.
Device saves measurements to internal memory if it is moved outside of cellular network coverage (e.g., on an open sea ship or in a mine). When the device has network connectivity again, it will send the measurements to the cloud service. Note that the device must not be shut down for this feature to work.
Contact Loopshore for more information.
Power Save
Power Save is a single on/off setting that controls how hard the device’s two most power-hungry sensors work while it is running on battery. It is on by default and can be turned on or off remotely; the change takes effect immediately, without a reboot.
When the device is on battery and Power Save is on, the device reduces power use by capping the microphone’s listening time at 50% (if it is set higher) and by sampling the particulate matter (PM) sensor more sparingly. When the device is connected to USB power, Power Save has no effect — the device always measures at full rate.
Turn Power Save off if you need full-rate microphone and particulate matter measurement while on battery. This gives more detailed data but consumes the battery noticeably faster. Power Save does not change the measurement interval or affect any other sensor.
CO2 (Carbon Dioxide)
By default, carbon dioxide is calibrated continuously so that it assumes that it sees outdoor CO2 levels at least once in a 7.5 day period. This works in 95% of cases and keeps the sensor correctly calibrated for several years (e.g. in schools and in offices CO2 level usually drops to 400 during weekends).
If the device is placed in conditions where CO2 level never drops to 400 (e.g., a 24/7 reception where there are always people present), it is recommended that CO2 automatic calibration is disabled completely and the device is manually calibrated in known conditions, e.g., once a year.
PM (Particulate Matter)
Particulate matter measurement has two default measurement intervals: 10 minutes and 60 minutes. A 10-minute interval is used when the device is connected to mains power (USB charger) and a 60-minute interval when the device is battery operated. PM measurement is also slightly more accurate when the device is connected to an external power source. This is because of the high power consumption of the PM sensor. PM measurement interval can be configured remotely from 10s to 24h. Note, however, that the PM measurement interval cannot be shorter than the device’s measurement interval: particulate matter is always measured and reported together with the other quantities, so it cannot be sampled more often than the measurement interval. If you need more frequent PM data, shorten the measurement interval accordingly.
tVOC (Total Volatile Organic Compounds)
The tVOC sensor is calibrated whenever the device has been powered off for more than a few minutes. Calibration takes less than 24 hours and can be observed from measured results: in the first few hours there are no measurement results for tVOC, and during the first 24 hours, results might be lower than after the calibration period.
Also note that the tVOC sensor is very sensitive to low absolute humidity. So if you, for example, have to transport the device in sub-zero winter weather, make sure that the device is always powered off and keep it powered off in normal indoor conditions for at least 1 hour before powering on.
VOC Index (Alternative)
The device supports an optional VOC Index measurement as an alternative to the standard tVOC measurement. The VOC Index uses the Sensirion SGP41 sensor and Sensirion’s Gas Index Algorithm to provide a relative air quality indicator on a scale of 1–500.
The algorithm uses a moving average over the past 24 hours as its baseline. The room’s normal VOC background is always mapped to the value 100. A value above 100 means there are more VOCs than the recent average (e.g. from cooking, cleaning, or breathing), while a value below 100 means fewer VOCs than the average (e.g. from an open window or air purifier).
After power-on, the sensor needs approximately 24 hours to fully learn the room’s typical conditions. During this learning period, the VOC Index is already available but may be less accurate as the baseline is still being established.
Unlike the absolute tVOC measurement (in ppb), the VOC Index provides better device-to-device consistency and is designed for detecting changes in air quality rather than measuring absolute concentrations.
The VOC Index is disabled by default. When enabled, the sensor draws a constant 3mA, which significantly affects battery life. Contact Loopshore for more information.
Ambient Light
Light sensor receives ambient light information from the back of the device, where light is reflected from the walls. The sensor is calibrated so that it is accurate on a normal white/light-colored wall. If you install the device on a black wall, for example, you might observe lower light level readings than actual.
SPL (Sound Pressure Level)
By default, the device listens to ambient sounds 50% of the time. This listening time (the microphone duty cycle) can be configured remotely. When the device is on battery and Power Save is on, the duty cycle is capped at 50%. This is merely a power consumption optimization.
The particle sensor fan sits a few centimetres from the microphone, so a sound pressure level measured while the fan spins would report the device’s own fan noise rather than the room. The device therefore measures sound only while the fan is stopped. If the measurement interval is short enough to keep the fan running continuously (below 65 s, or below 20 s in Power Save), no sound pressure level is reported at all. The feature is available on second-generation (Gen 2) devices, and an administrator can turn it off from the service.
Movement and Shock Detection
Device can detect its orientation in space, whether it has been moved or not and g-forces applied to it and the structure it is mounted to. See more in Appendix 1.
Locating the Device
The device can be asked to play a sound so that you can find it by ear – when it is known to be somewhere in a particular room, or when one specific unit has to be picked out of several in storage. An administrator requests the sound from the service; the device never starts playing on its own.
The sound begins almost inaudibly and rises to full volume over about 30 seconds. It is a repeating high-pitched three-note chime and plays for roughly a minute in total. Moving or shaking the device silences it immediately – a light touch may not be enough. Otherwise it stops on its own.
Nothing is heard if the device’s battery is below approximately 3.1 V. The feature is available on second-generation (Gen 2) devices.
Product Info
Markings
Product label is found from the back of the device and from the package.
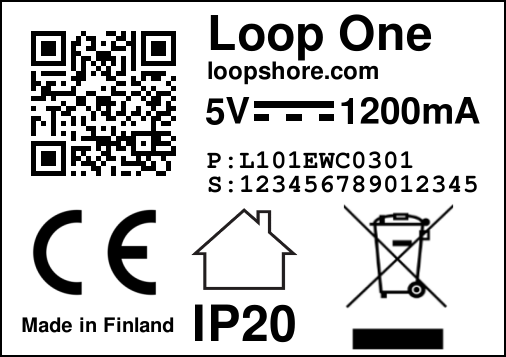
- Product’s serial number is marked with
S: serial_number. This serial number is also the device’s Device ID — the identifier shown in the Loopshore service and in notification emails. - Product’s product code is marked with
P: product_code
Interpreting the Product Code
XXXXXXXXXXX
XX--------- Product, L1=Loop One, L0=Loop Zero, LD=Loop Delta
--XX------- Version, e.g. 03
----X------ Approval, E = EU, P = Prototype
-----X----- Color, W = White, G = Grey, B = Black
------X---- Material, P = Plastic(ABS), C = Durasense(Biocomposite), 3 = 3D-printed
-------XX-- Battery, 02 = Li-Ion 1x4900mAh, 03 = Li-Ion 2x4900mAh
---------XX Lot, Lot identifier
Product Code Example
| Code | Description |
|---|---|
| L103EWC0301 | Loop One, version 03, EU approved, white, Durasense biocomposite, 2×4900mAh battery, lot 01 |
Battery Wh
- 02 = Li-Ion 1x4900mAh / 17.78Wh
- 03 = Li-Ion 2x4900mAh / 35.56Wh
Technical Data
Table 1: Operating Conditions
| Parameter | Value |
|---|---|
| Temperature range, all measurements | 0°C to 40°C |
| Temperature range, device | -20°C to 40°C, some measurements limited (see Table 1b) |
| Humidity range | 0 to 85%, non-condensing* |
Operating the device out of recommended conditions may affect accuracy and lifetime of the device or specific sensors.
*tVOC sensor has optimal performance at 20–65% RH.
Table 1b: Sensor Operating Ranges
The operating ranges are those stated in the sensor manufacturers’ datasheets. The device operates outside these ranges, but the results of the affected measurement are not reliable. The sensor datasheets are listed in the Loopshore Sensors document.
| Measurement | Sensor | Operating range (manufacturer) | Notes |
|---|---|---|---|
| Temperature, humidity | Sensirion SHT45 | -40°C to +125°C, 0–100%RH | Humidity measurement is most accurate at +5°C to +60°C and 20–80%RH. Also operates in condensing conditions. |
| CO2 | Senseair Sunrise | 0°C to +50°C, 0–85%RH, non-condensing | Does not measure below freezing. Best accuracy at +15°C to +35°C. |
| tVOC | Renesas ZMOD4410 | -40°C to +65°C, 0–90%RH, non-condensing | Most accurate at 0°C to +40°C. Sensitive to low absolute humidity. |
| VOC index | Sensirion SGP41 | -10°C to +50°C, 0–90%RH, non-condensing | Humidity compensation is optimized for dew points of -13°C to +31°C. |
| Particulate matter | Sensirion SPS30 | -10°C to +60°C, 0–95%RH | Most accurate at +10°C to +40°C and 20–80%RH. |
| Air pressure | Bosch BMP581 | -40°C to +85°C | |
| Ambient light | Silicon Labs Si1151 | -40°C to +85°C | |
| Sound pressure level | TDK ICS-43434 | -40°C to +85°C | |
| Motion | ST LIS3DH | -40°C to +85°C | |
| Battery | Li-Ion | Operation -20°C to +60°C, charging 0°C to +45°C | Approximately 70% of rated capacity at -10°C. The device does not charge the battery below 0°C. |
First-generation (Gen 1, product code L101…) devices use some different sensors. Temperature and humidity are measured with a TI HDC2080 sensor, whose humidity measurement operates at -20°C to +70°C. Air pressure is measured by a Bosch BMP280, which has full accuracy at 0°C to +65°C. The tVOC sensor, Sensirion SGPC3, requires a temperature of at least +5°C and an absolute humidity of 4 g/m³, so tVOC measurement on Gen 1 devices does not work below freezing. The other sensors are the same as in Gen 2 devices. The VOC index is available only on Gen 2 devices.
Table 2: Device Specifications
| Parameter | Value |
|---|---|
| Size (WxHxD) | 96x132x35mm |
| Weight | 300g |
| Batteries | 1 or 2 pieces Li-Ion 3.63V / 4900mAh |
| Charging | 5VDC, USB-C |
| Microprocessor | ARM Cortex-M33 |
| Radio | NRF9160 |
| Frequency/Band | B1, B2, B3, B4, B5, B8, B12, B13, B14, B17, B18, B19, B20, B25, B26, B28 and B66 (700-2200 MHz) |
Measurement Ranges and Accuracy
Table 3: Relative Humidity
| Parameter | Value |
|---|---|
| Range | 0 to 100% |
| Accuracy (typical) | ±2% |
| Accuracy (maximum) | ±3% |
Table 4: Temperature
| Parameter | Value |
|---|---|
| Range | -40°C to 85°C |
| Accuracy (typical) | ±0.2°C |
| Accuracy (maximum) | ±0.4°C |
Table 5: Particulate Matter
| Parameter | Value |
|---|---|
| Concentration range | 0 to 1000μg/m³ |
| Particle size range | 0.3 to 10μm |
| Accuracy PM1.0, PM2.5 (0-100μg/m³) | ±10μg/m³ |
| Accuracy PM1.0, PM2.5 (100-1000μg/m³) | ±10% |
| Accuracy PM4.0, PM10 (0-100μg/m³) | ±25μg/m³ |
| Accuracy PM4.0, PM10 (100-1000μg/m³) | ±25% |
Table 6: Carbon Dioxide
| Parameter | Value |
|---|---|
| Range | 400 to 5000ppm |
| Accuracy | ±(30ppm + 3%) |
Table 7: Volatile Organic Compounds
| Parameter | Value |
|---|---|
| Concentration range | 0 to 60000ppb |
| Accuracy (typical) | 15% |
| Accuracy (maximum) | 40% |
Table 7b: VOC Index (Alternative)
| Parameter | Value |
|---|---|
| Range | 1 to 500 (index) |
| Baseline | 100 (normal room conditions) |
| Learning time | 24 hours |
Table 8: Atmospheric Pressure
| Parameter | Value |
|---|---|
| Range | 300 to 1100hPa |
| Relative accuracy | 12Pa |
| Absolute accuracy | ±1hPa |
Table 9: Sound Pressure Level
| Parameter | Value |
|---|---|
| Range | 35 to 100dB |
| Accuracy | ±3dB |
Table 10: Ambient Light
| Parameter | Value |
|---|---|
| Concentration range | 0 to 100000lx |
| Accuracy | ±20% |
Table 11: Motion
| Parameter | Value |
|---|---|
| Range | 0 to 16g |
| Accuracy | N/A |
Device Remote Monitoring and Operation
Note that the device comes with Loopshore’s 24/7 remote monitoring and upgrading service. This means that Loopshore will monitor that all devices are working correctly and actions are made if deviations are detected. These actions may include, but are not limited to SW upgrades, configuration changes, default behavior changes and customer communication.
If there are changes that affect this document, this document will be updated accordingly.
Appendices
Appendix 1 - Movement and Shock Detection
Loop One’s built-in movement and shock detection can be used to detect various things. These are for example:
- Whether device has been moved.
- What is the device’s orientation in space.
- How much g-forces is applied to the device and structures that it is mounted on.*
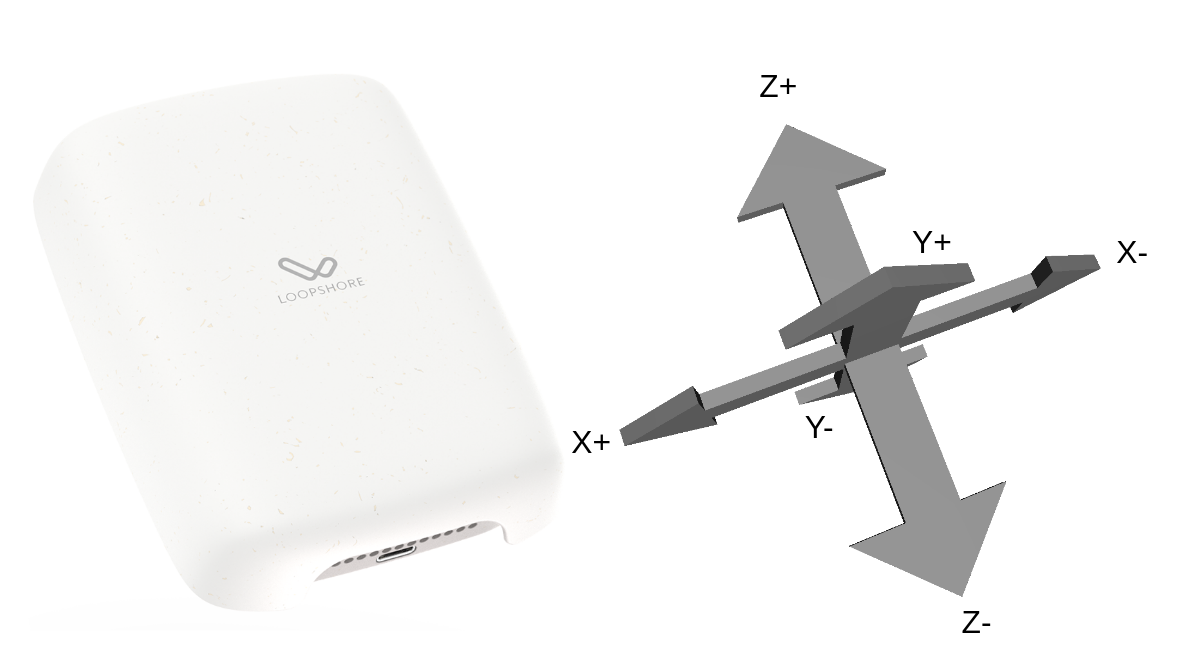
For these acceleration measurements, device is constantly monitoring its movement. If device is moved even a bit, it starts a precise acceleration detection for few seconds. The maximum acceleration detected on each axis is then reported to cloud service (in m/s²) along with other measurements. By default device can detect forces up to 8g and uses 100Hz sampling interval.
Orientation Specific Reports
If a device has not moved since last measurement report was sent, its stationary orientation is measured and reported to the cloud service. After this report is sent, no acceleration data is reported until movement occurs again.
Acceleration report consist of 6 values. Each value is representing maximum acceleration detected for each direction. Picture below shows the direction of acceleration.
Example of Interpreting Raw Data
- Z- and Z+ are both 9.8m/s²
- Y- and Y+ are 0m/s²
- X- is -0.2m/s² and X+ is +0.2m/s²
This means that device is straight, but upside down and shaking mildly sideways.
Shock Report
Device also reports maximum g-force applied to it since the last time measurement report was sent. If device has not moved, this value is absent.
* Note that using just magnetic mount will affect greatly on the measurement results. If accurate acceleration measurements are desired, glue and/or metal band fix is recommended.
LOOPSHORE | Hämeenkatu 13 A 5, 33100 Tampere | info@loopshore.com | loopshore.com
© 2025 Loopshore